Java harness reliability / six-guide learning path · Guide 6 of 6. Begin with the stated failure and test the resource or state boundary before changing concurrency or JVM settings.
Begin with the harness symptom and its time window
A Java harness slows down while assembling many synthetic tool results. It is tempting to lower a G1 pause target immediately. First identify the symptom: response latency, CPU saturation, growing queue delay, retained memory or individual stop-the-world pauses. A collector is only one possible contributor. Changing flags before aligning the time window and workload can make an experiment look different without explaining the original slowdown.
Record a baseline with the same admitted concurrency, payload sizes, tool fixtures and evaluation path. A workload that silently rejects more requests may show lower allocation and shorter pauses while serving less useful work. Compare accepted and completed operations alongside latency and resource metrics. The browser lab uses declared artificial fixtures to practice this distinction; it does not collect data from your process.
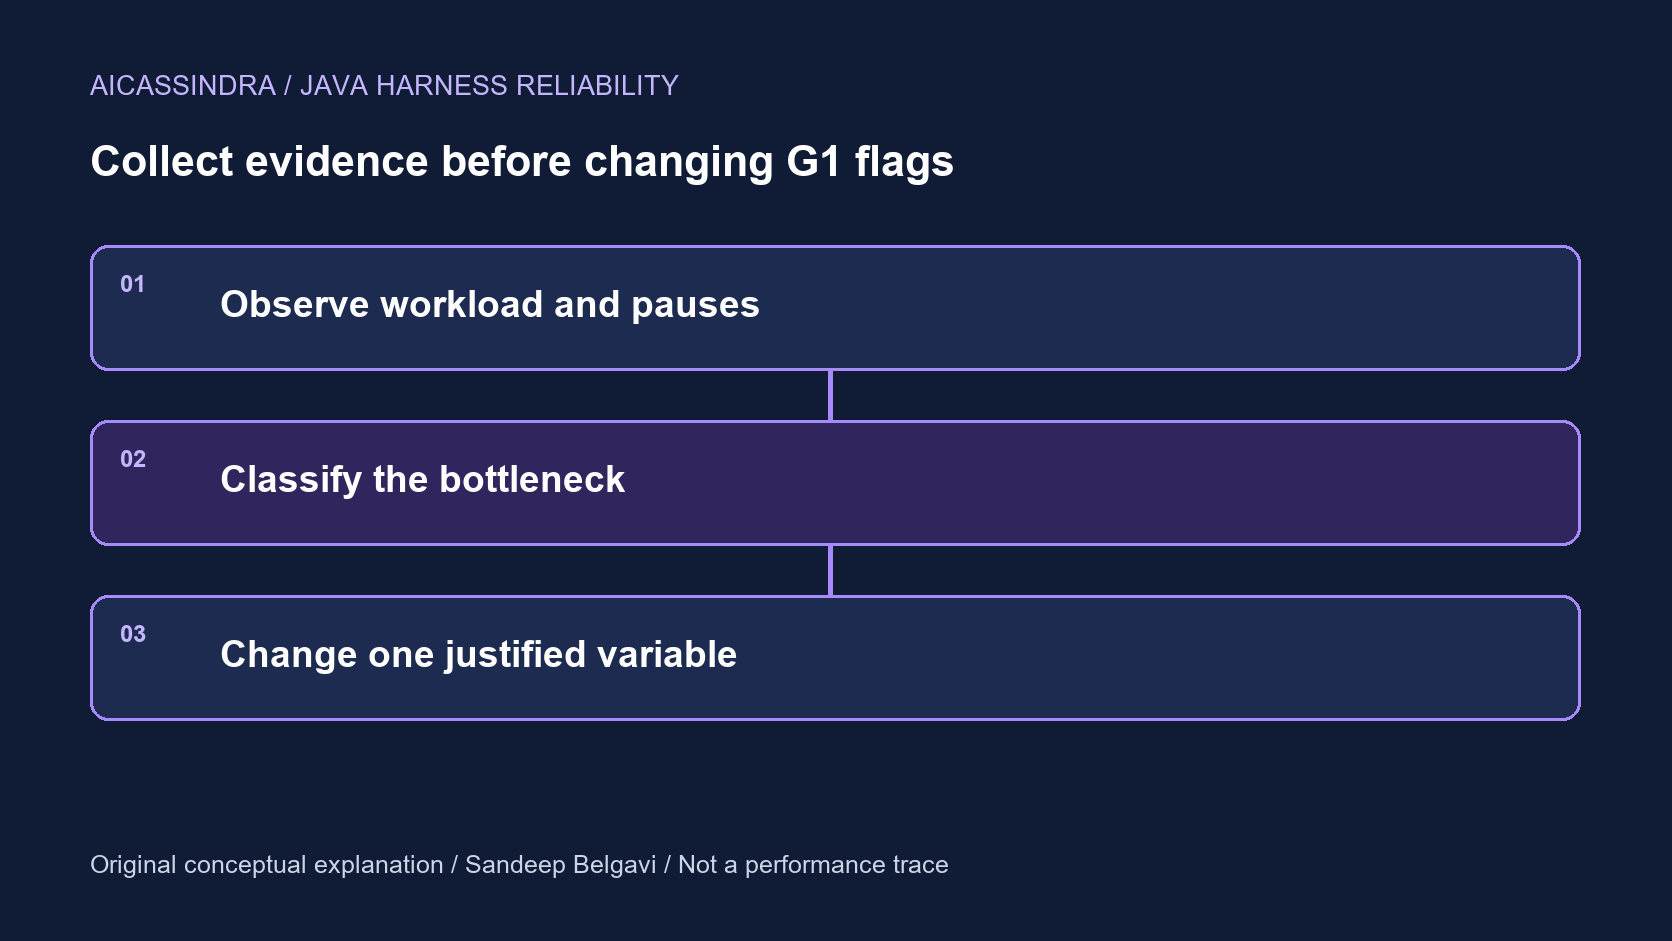
- STEP 1Observe workload and pauses
- STEP 2Classify the bottleneck
- STEP 3Change one justified variable
Treat the pause goal as a goal
G1 uses regions and chooses collection work with pause-time goals in mind, but it is not a hard real-time collector. A selected pause target does not impose an absolute upper bound on every pause or on end-to-end response latency. The collector also competes for resources and performs work outside individual application pauses. Keep those dimensions separate when deciding what to change.
The G1 tuning guide recommends beginning with its ordinary adaptive behavior and a small, justified set of settings rather than copying a long flag list. Fixing young-generation size can interfere with its pause-control decisions. This article does not prescribe a universal heap size, region size or target. A hypothesis must name the observed bottleneck and the metric expected to move.
Distinguish allocation churn from retained growth
In the churn fixture, invented post-collection occupancy stays near its starting level while pauses vary. That pattern suggests examining which paths allocate heavily, but it is not proof of a leak. In the retained-growth fixture, successive invented occupancy values rise. The next investigation should identify what stays reachable and why. Increasing heap capacity might postpone pressure without removing the retained references.
In the third fixture, synthetic GC pauses are short while the supplied application symptom is a much longer delay. GC data alone cannot assign that delay to a lock, CPU or I/O. The appropriate conclusion is that more evidence is required. A toy classifier that always recommends a collector flag would hide exactly the uncertainty an engineer needs to resolve.
Collect the evidence that can distinguish the hypotheses
Unified GC logging can describe collection activity, and Flight Recorder can relate execution samples, allocation evidence and thread-stalling events to the same investigation. Select events and thresholds deliberately: absence of an event in a recording is not proof that the underlying activity never occurred. Recording settings, sampling and diagnostic overhead affect what is visible.
Use a bounded synthetic run before enabling additional diagnostics on a busy process. Keep the recording configuration and command line with the result. Allocation events identify allocation sites rather than automatically proving long-term retention. Object lifetime and reachability need additional evidence. A thread-park event also needs context; a worker waiting for a deliberate admission permit is different from unexplained contention.
Make one change and preserve the comparison
Write the prediction before rerunning: reducing a temporary result aggregation should reduce allocation on that path, while a larger queue may increase retention. Keep load, admission limits, runtime version and workload shape fixed where possible. If the change also alters those variables, state that the experiment no longer isolates a collector setting. Repeat only when the result, noise or an unresolved question justifies it.
The downloadable AllocationProbe creates a fixed number of small byte arrays and retains only a bounded number. Its printed payload counts are not peak-memory or GC-pause measurements. Optional logging and recording commands are supplied for local exploration. Report actual logs only after running and inspecting them; compiling the program and seeing its final line is not a G1 tuning result.
Run the Java boundary check
Use a JDK with Java 21 APIs or later. Save the original AllocationProbe.java into an empty local directory. The example uses only the JDK and synthetic fixtures; no model, network service or credentials are required.
javac --release 21 AllocationProbe.java
java -ea AllocationProbe
// Author: Sandeep Belgavi. Bounded synthetic allocation workload for local diagnostics.
import java.util.ArrayDeque;
public class AllocationProbe {
private static volatile long checksum;
public static void main(String[] args) {
var retained = new ArrayDeque<byte[]>();
for (int i = 0; i < 512; i++) {
byte[] block = new byte[64 * 1024];
block[0] = (byte) i;
retained.addLast(block);
if (retained.size() > 16) retained.removeFirst();
checksum += retained.peekFirst()[0];
}
if (retained.size() != 16) throw new AssertionError("Retention bound changed");
System.out.println("blocks_created=512 max_retained_blocks=16 payload_per_block=65536 bytes");
System.out.println("Synthetic workload only; no pause-time or speed conclusion follows.");
}
}
Optional local exploration after compilation: run the bounded probe with G1 logging and a Flight Recorder profile. The program may finish quickly; it does not promise a particular collection count or event set. Inspect the resulting files before drawing any conclusion. These flags were checked on the local HotSpot JDK 23 runtime; other distributions and versions require their own compatibility check.
java -Xms32m -Xmx64m -XX:+UseG1GC -Xlog:gc*:file=gc.log \
  -XX:StartFlightRecording=filename=allocation.jfr,settings=profile,dumponexit=true \
  AllocationProbe
The backslash continuations above are POSIX-shell notation. In PowerShell, put the command on one line or use its backtick continuation character. The supplied probe deliberately avoids System.gc and never claims that its bounded retained payload equals peak heap consumption.
Compatibility check: the examples were compiled with --release 21 and executed on local HotSpot JDK 23.0.2. This checks the demonstrated invariants on that runtime; it is not a JDK performance comparison. APIs and diagnostic descriptions are linked to the Java 25 documentation, accessed 30 October 2026. No preview API is required.
Try the companion browser lab
Open G1 evidence triage: classify a synthetic pause fixture. Before lowering the comparison target, predict whether the five existing pauses will change. Then select retained growth and explain why a larger heap would not by itself prove the retention cause was fixed.
Expected outcome: The comparison target changes the count of over-target observations, not the pause values. Retained-growth data ends above its starting post-GC occupancy. The non-GC fixture has short pauses despite its declared application-latency symptom.
Scope: All five-point fixtures are invented and intentionally small. The nearest-rank percentile is only descriptive for these five values. This is not a GC implementation, log parser, pause predictor, production diagnosis or evidence that a JVM flag improves performance.
Primary sources and evidence limits
- G1 tuning recommendations
- G1 behavior and collection concepts
- Diagnosing performance with Flight Recorder
- Java launcher and diagnostic flags
The scenarios, diagrams, arithmetic and code are original educational examples. Browser ticks are synthetic. Java fixture success is not evidence of production throughput, latency, memory use or model quality.
Views are my own and do not represent any employer, past or present.