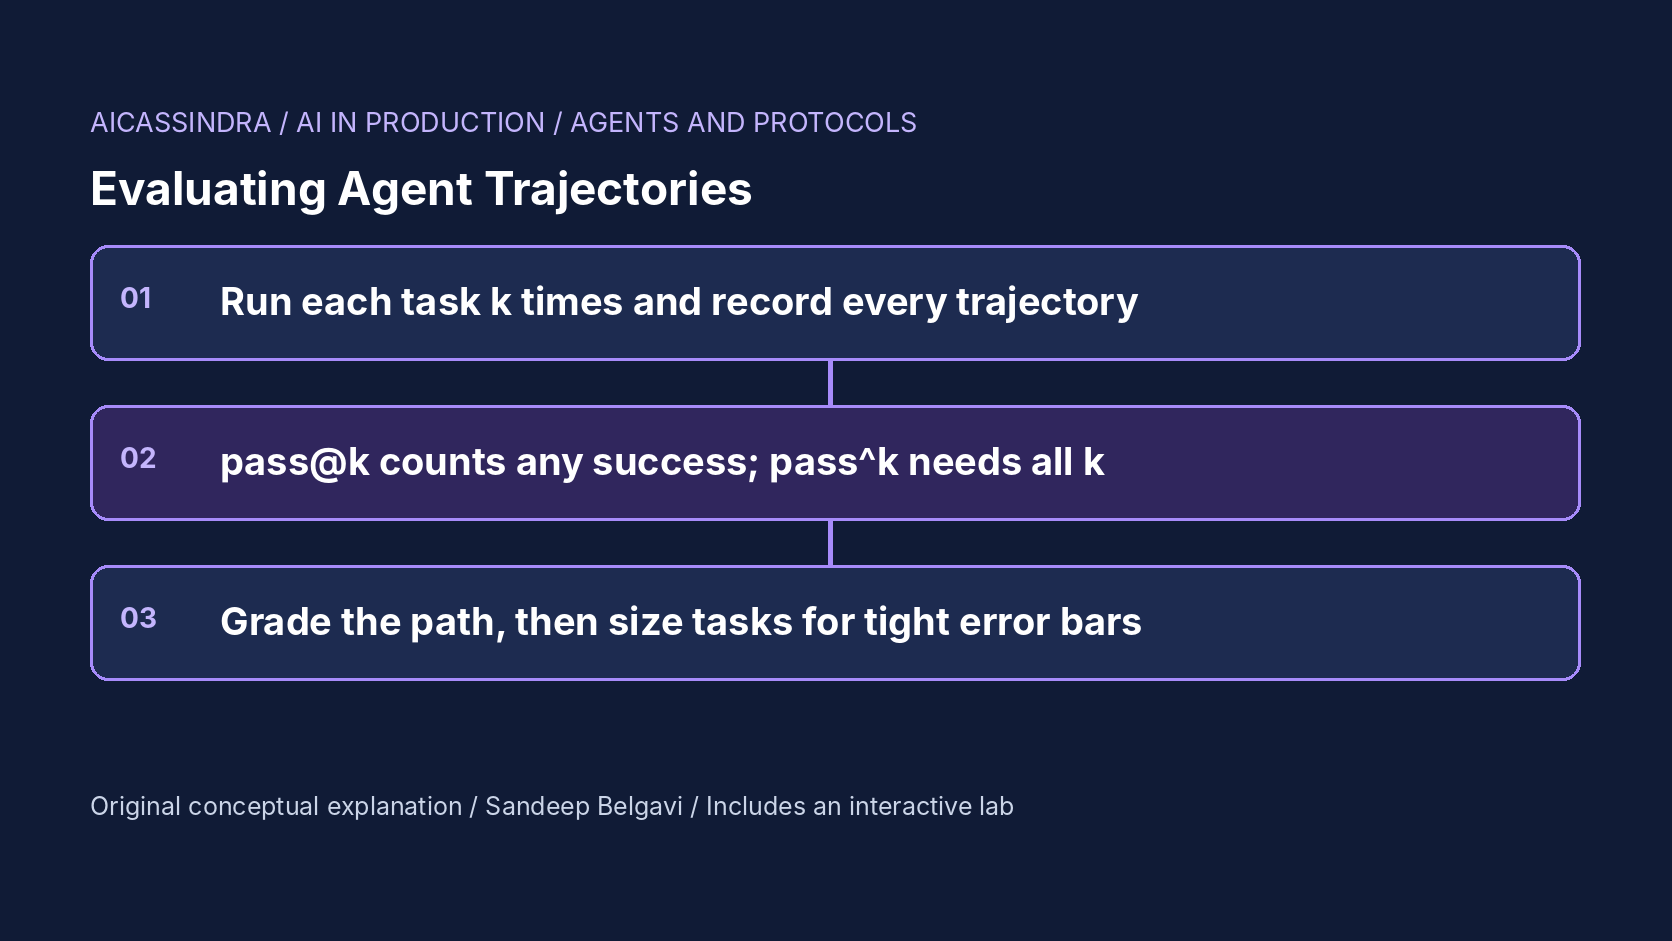
An agent that solves 99% of a benchmark "at k = 8" sounds ready for production. It may not be. pass@k counts a task as solved if any of k attempts succeeds, which is the right question for code generation with a test suite to pick the winner, and the wrong question for an agent a customer talks to once per problem. That customer gets one trajectory. If the same request comes back tomorrow, they get another one, and they remember the time it failed.
This guide is about evaluating agents the way users experience them. It covers the arithmetic behind pass@k and its stricter sibling pass^k, why the two diverge so quickly for multi-step agents, why grading only the final state hides agents that reach the right answer by breaking policy, and how many tasks and trials you need before a one-point change in your eval means anything. It ends with knobs in real eval tooling and a worked example. The lab lets you run synthetic agent trajectories and watch pass@k and pass^k pull apart as k grows.
Two metrics from the same trials
Run an agent n times on each task in an eval set and count the successes c for each task. From those counts you can estimate two very different things.
pass@k is the probability that at least one of k attempts succeeds. The unbiased estimator popularised by the Codex paper is computed per task and averaged:
pass@k = 1 - C(n - c, k) / C(n, k)      # at least one of k succeeds
pass^k = C(c, k) / C(n, k)              # all k succeed (tau-bench)

# a single task with true success rate p, ignoring estimation:
pass@k = 1 - (1 - p)^k
pass^k = p^k
pass^k (read "pass hat k" or "pass to the power k"), introduced with the tau-bench benchmark for tool-using agents, is the probability that all k independent attempts succeed. It answers the question "if a user brings this task k times, will it work every time?"
For a single task with success rate p = 0.8, pass@8 is 1 − 0.2^8 ≈ 0.99999 while pass^8 is 0.8^8 ≈ 0.17. Both are computed from the same trials. One says the agent is essentially perfect; the other says that a user who brings the task eight times will almost certainly see it fail at least once. Neither is wrong. They answer different questions, and only one of them is the question a product owner is asking.
Both metrics collapse to the same number at k = 1: the mean success rate, pass@1. The interesting information is in how fast they separate. A large gap between pass@k and pass^k at modest k means the agent is capable but inconsistent: it can do the task, but whether it does depends on the sample.
Why multi-step agents are inconsistent
Consistency gets harder with every step. If each step of a trajectory has an independent chance e of going wrong that the agent does not recover from, a task of L steps succeeds with probability (1 − e)^L. With e = 3% and L = 8 that is 0.78; with e = 5% it is 0.66. Small per-step differences become large per-task differences, and pass^k raises them to a further power.
Real agents also recover. They notice a tool error, re-read the result, and try again. That gives each step an effective failure rate of e × (1 − r), where r is the probability of recovering from a mistake, at the price of extra steps. Two quantities therefore drive reliability: how often the agent slips and how well it gets back on track. Sampling settings can move both. More randomness can mean more slips, and too little can leave an agent repeating the same failing action. Whether your agent behaves like that is an empirical question; the lab models it as an explicit assumption so you can see the shape: a band of temperatures where pass^4 peaks, with slips dominating on one side and unrecovered loops on the other.
The heterogeneity across tasks matters just as much. A typical eval set mixes tasks the agent nearly always solves, tasks it never solves, and a middle band where it succeeds sometimes. pass@k is driven by the middle and easy bands (anything with p above zero eventually succeeds); pass^k is dragged down by the middle band, because those tasks almost never succeed k times in a row. Improving the middle band is usually where reliability work pays off.
Outcome grading misses the path
Most agent benchmarks grade the final state: did the database end up as expected, did the test suite pass, did the ticket get the right status. Final-state grading is robust and cheap, and you should keep it. But it is blind to how the agent got there.
Consider a hypothetical support agent for Belgavi's Book Store whose policy says identity must be verified before an order is cancelled. A trajectory that skips the verification and cancels the right order produces exactly the same final state as one that follows the policy. An outcome grader scores both as passes. In production the first one is an incident: the same shortcut on a different conversation cancels someone else's order.
Trajectory grading adds checks on the sequence of actions. The common forms are:
- Policy assertions: rules over the trace, such as "cancel_order must be preceded by verify_identity for the same customer" or "no refund above the limit without an approval record".
- Reference trajectory match: compare tool calls to an expected sequence, strictly, ignoring order, or as a subset or superset. Strict matching is brittle because there are usually many valid paths; subset matching ("these calls must appear") is often the useful middle ground.
- Judge-based review: a model or a person reads the trace against a rubric. Flexible, but it needs its own calibration against human labels.
- Budget checks: step count, tokens and wall time within limits, so that a run that succeeds after 40 tool calls is not counted the same as one that took six.
In the lab, the policy-bait event makes 60% of tasks offer such a shortcut. With the final-state grader, around 17% of passing runs quietly broke policy at the lab's default settings, and pass^4 looks healthy. Switch to trajectory grading and those runs become failures. Mission two asks you to make the grader honest and then fix the agent, which in the lab means adding a verification step before the irreversible action: it costs one step per run and catches most shortcuts.
How many tasks and how many trials?
An eval is a measurement, and a measurement without error bars invites people to ship noise. The useful decomposition is between task-to-task variance and trial-to-trial variance. If task success rates p_j vary across tasks with variance σ²(between), and each task is run n times, the variance of the overall mean over T tasks is approximately:
Var(pass@1) ~= ( sigma2_between + mean(p * (1 - p)) / n ) / T

# illustrative: sigma2_between = 0.04, mean(p(1-p)) = 0.12
T = 40,  n = 16 :  (0.04 + 0.0075) / 40  = 0.00119  -> 95% CI about +/- 6.8 points
T = 300, n = 2  :  (0.04 + 0.06)   / 300 = 0.00033  -> 95% CI about +/- 3.6 points
T = 400, n = 1  :  (0.04 + 0.12)   / 400 = 0.00040  -> 95% CI about +/- 3.9 points
The first line is the trap. Sixteen trials of forty tasks cost 640 agent runs and still leave an interval of nearly seven points, because the extra trials keep re-measuring the same forty tasks. The between-task term does not shrink with n at all. Spreading a similar budget over more tasks halves the interval. One trial per task is not ideal either: it makes the within-task term large and gives you no way to estimate consistency, because pass^k needs at least k trials per task.
| Goal | What to run | Why |
|---|---|---|
| Detect a change in mean success | Many tasks, 2 to 3 trials each | Between-task variance dominates |
| Estimate pass^k | At least k trials per task, ideally 2k | The estimator needs n ≥ k |
| Compare two agent versions | The same tasks for both, paired difference | Task difficulty cancels out |
| Find failure modes | Read failing trajectories, not just counts | Counts do not say why |
Evan Miller's "Adding Error Bars to Evals" makes the same points more formally, including clustered standard errors when tasks share a source document and paired comparisons between models. The paired point is worth repeating: when two versions run on identical tasks, analyse the per-task difference. It removes most of the between-task variance from the comparison and can detect changes that unpaired intervals would hide. Mission three asks you to shrink the interval to ±4 points with at most 800 runs; the 40 × 16 setup cannot get there with any number of trials.
Cost belongs in the scorecard
Agents are expensive to run, and some reliability gains are bought with steps. A run that retries until it succeeds, or that loops until it hits the step budget and then fails, costs real money either way. Cost-controlled evaluation of agents argues for reporting accuracy alongside cost, because a leaderboard that ignores cost rewards brute force: more retries, more samples, longer runs.
The useful production metric is cost per successful task, not cost per run. If a run costs 7.5 steps at an illustrative $0.004 per step, that is $0.030 per run. At 80% success the cost per passing run is $0.0375, or about $37.50 per thousand. The step budget is the main lever. A budget that is too tight turns legitimate retries into failures; a budget that is too loose lets runs that are already stuck burn steps before failing. Mission four puts you on a flaky tool with an eight-step budget and asks for pass^4 of at least 47% at no more than $38 per thousand passing runs. The answer is a band of budgets, not "as large as possible".
Knobs in real eval tooling
You do not need a specific framework to compute these metrics, but most tools now support repeated trials and trajectory checks. Names and defaults change, so check the documentation for your version.
- Repeated trials. Inspect, the open-source eval framework from the UK AI Security Institute, runs each sample for several epochs and combines scores with reducers; it ships reducers for means and for pass-at-k-style aggregation. Many in-house harnesses simply loop over seeds. Whatever you use, store every trial's trajectory, not just its score, so you can compute pass^k later and read failures.
- Trajectory evaluators. LangChain's
agentevalspackage offers trajectory match evaluators (strict, unordered, subset and superset modes) and LLM-as-judge trajectory evaluators. Policy assertions are usually easier to write yourself as plain functions over the trace. - Benchmarks. tau-bench reports pass^k for tool-calling agents in simulated customer-service domains and showed that it falls steeply as k grows for the agents it tested. Use its methodology on your own tasks rather than relying on its numbers.
A minimal harness that records what you need is short:
from math import comb

def pass_at_k(n, c, k):  return 1.0 if n - c < k else 1 - comb(n - c, k) / comb(n, k)
def pass_hat_k(n, c, k): return comb(c, k) / comb(n, k)

def grade(trace, final_state, task):
    if not task.check_final_state(final_state):
        return False
    for rule in task.policy_rules:          # e.g. verify_identity before cancel_order
        if not rule(trace):
            return False
    return len(trace.steps) <= task.step_budget

results = {t.id: [grade(*run_agent(t, seed=s), t) for s in range(n)] for t in tasks}
counts  = {tid: sum(r) for tid, r in results.items()}
report  = {k: mean(pass_hat_k(n, c, k) for c in counts.values()) for k in (1, 2, 4)}
A worked example: the leaderboard number versus the release gate
Suppose the Belgavi's Book Store support agent is evaluated on 120 synthetic tasks with 8 trials each, as in the lab's default setup. The leaderboard-style report says pass@8 is 100% and pass@1 is 80%. Those numbers are calculated by the lab, not measured on any real agent.
Now ask the release question: on what share of tasks does the agent succeed four times out of four? At the default temperature, pass^4 is roughly 42% and pass^8 is under 20%. Most tasks are in the inconsistent middle band. Lowering the lab's temperature to around 0.5 raises pass@1 to about 86% and pass^4 to about 59%: a six-point gain in mean success becomes a seventeen-point gain in consistency, because pass^4 raises each task's improvement to the fourth power.
Then add the honest grader. With policy-bait tasks and outcome grading, pass^4 looks fine at about 62%. With trajectory grading and no verification step, it falls to about 34%, because one passing run in six was a policy violation. Adding a verification step brings it back to about 55%. The release gate the team should write down is therefore something like "pass^4 at least 50% under trajectory grading, on at least 300 tasks, with the 95% interval reported", not "pass@8 above 95%".
Failure modes and common mistakes
Evaluation mistakes are quieter than production failures, which is why they persist.
- Reporting pass@k for an interactive product. If users cannot pick the best of k answers, pass@k is a capability metric, not a reliability metric. Report pass@1 and pass^k next to it.
- Fixing the seed and calling it consistent. Running each task once at temperature zero gives one trajectory per task, not a measure of consistency. Provider-side nondeterminism, tool latency and changing data mean production will not be that deterministic anyway.
- Grading only the final state. Count policy violations among passing runs. If that number is not zero, your score includes incidents.
- Too few tasks. A 30-task eval cannot distinguish a three-point regression from noise. Report intervals and use paired comparisons between versions.
- Ignoring flakiness in tools. If a dependency fails transiently, separate infrastructure failures from agent failures in the report, and decide whether the agent is expected to retry.
- Contaminated or stale tasks. Tasks copied from public benchmarks may be in training data; tasks written once and never refreshed drift away from real traffic.
In production, sample real conversations, replay them in a sandbox with recorded tool responses, and run each several times. The fraction of replayed tasks that succeed on every replay is the closest offline proxy you will get for the reliability users feel.
Run the lab: pass@k vs pass^k: grade agents the way users experience them
The lab runs a synthetic agent on a set of multi-step tasks, several trials per task. The grid on the left shows the first tasks as rows and trials as columns: green passed, red failed, orange took a policy shortcut that the trajectory grader rejects, and lime took a shortcut that a final-state grader counted as a pass. The chart on the right shows pass@k and pass^k for every k up to the number of trials, with your chosen k marked. Start with the leaderboard-style default and notice how far apart the two curves are, then work through the missions.
Prefer a full-width view? Open the standalone lab. Your stars are saved in this browser and shown on the series hub.
What to do next
- Add pass@1 and pass^k (with k equal to how often a user realistically repeats a task) next to any pass@k number you report.
- Run every eval task at least k times and store the full trajectory of every run, not just the score.
- Write three to five policy assertions over trajectories for your highest-risk tools and count violations among passing runs.
- Report a 95% confidence interval for every headline number and compare agent versions with paired per-task differences.
- Grow the task set before adding trials: aim for hundreds of tasks with two or three trials each.
- Track cost per successful task and set the step budget from the distribution of steps in passing runs.
Sources and further reading
- Chen et al., Evaluating Large Language Models Trained on Code (pass@k estimator)
- Yao et al., tau-bench: A Benchmark for Tool-Agent-User Interaction in Real-World Domains
- Miller, Adding Error Bars to Evals: A Statistical Approach to Language Model Evaluations
- Kapoor et al., AI Agents That Matter
- LangChain agentevals: trajectory evaluators
Related in this series:
- Human Approval Gates That Keep Agents Safe Without Becoming the Bottleneck
- Why Agent Loops Run Away and How Step Budgets Stop Them
- Retrying Agent Tool Calls Without Executing the Same Action Twice
Diagrams, examples and the lab model are original educational material. Lab numbers are calculated by a synthetic model, not measured on real hardware or services.
Views are my own and do not represent any employer, past or present.