Java harness reliability / six-guide learning path · Guide 5 of 6. Begin with the stated failure and test the resource or state boundary before changing concurrency or JVM settings.
Start with the process limit rather than Xmx alone
A harness process has a hypothetical 2,048 MiB memory limit and a 1,536 MiB heap cap. It appears to have 512 MiB spare. That margin also has to accommodate native consumers, code and metadata, platform-thread stacks, direct buffers and operational headroom. Raising concurrency can consume these categories or retain more work inside the heap, even when the configured maximum heap never changes.
Treat the lab as a planning worksheet with explicitly separate allowances. It adds a heap budget, a direct-buffer budget, a platform-stack allowance, an other-native allowance and a safety allowance. The result is a proposed allocation envelope. It is not an estimate of exact current resident memory. An intentionally conservative envelope can exceed a process limit before the process would actually touch all those pages.
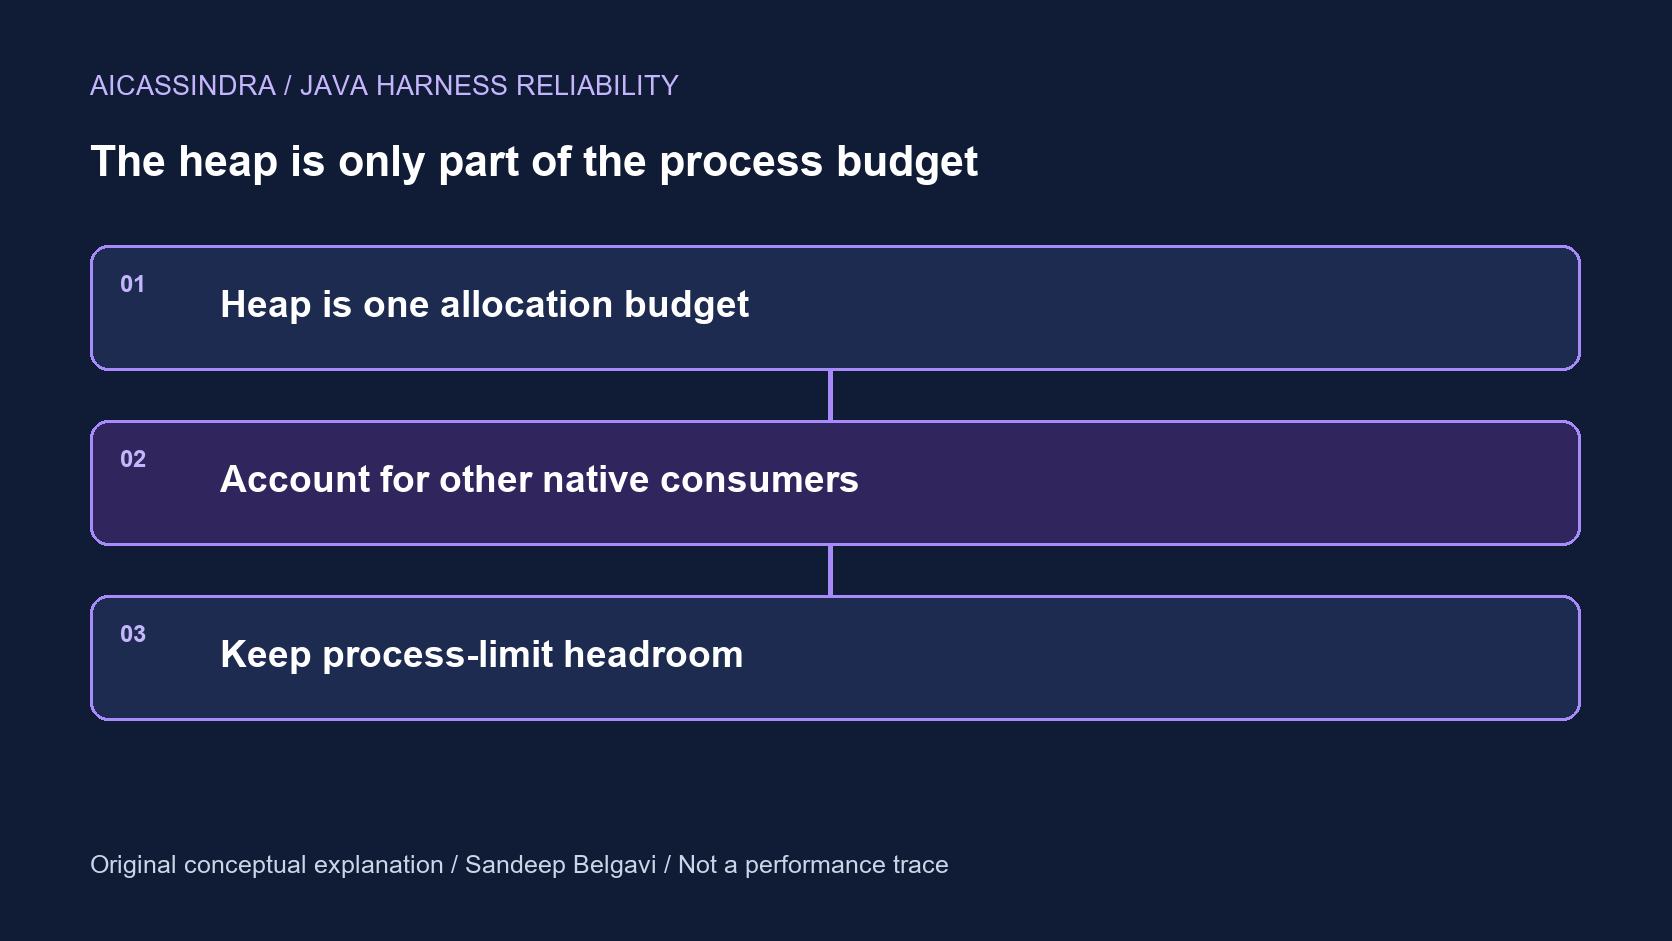
- STEP 1Heap is one allocation budget
- STEP 2Account for other native consumers
- STEP 3Keep process-limit headroom
Do not add overlapping memory counters
Heap used, heap committed, NMT committed memory, process RSS and container usage describe different views. Some categories overlap. Adding a process-wide total to its components double-counts memory. Virtual reservation is another distinct quantity: reserving address space is not equivalent to making all of it resident. Before comparing graphs, label each metric's scope, unit, sampling interval and relationship to the limit that can terminate the process.
Platform-thread stack size is useful in a planning allowance, but configured stack size times thread count is not a measured RSS formula. Virtual-thread stacks are managed differently and should not be charged one full native platform stack per virtual thread. A virtual-thread-heavy harness can still consume substantial heap and other resources through captured task state, buffers and its carrier threads.
Use NMT as one bounded source of evidence
HotSpot Native Memory Tracking must be enabled at startup with the selected tracking level. Its summary and baseline/diff views help investigate changes in tracked JVM categories. It does not provide a complete inventory of all third-party native allocations, and it has its own diagnostic overhead. Interpret it together with process and operating-system evidence rather than expecting every unexplained byte to appear in one category.
A small diagnostic sequence is to establish a baseline at a declared lifecycle point, run a controlled synthetic workload, then inspect the difference. Use the exact process identifier rather than applying diagnostic commands indiscriminately to every JVM. Separate warm-up growth from sustained growth under repeated equivalent workloads. The related native-memory guide in the Java collection provides a longer diagnosis path; this article focuses on the admission and budgeting decision.
Make concurrency part of memory ownership
An admitted task may retain its input, intermediate output, trace events and callback closures. A queue can keep those objects reachable after the useful response deadline. Direct buffers and pooled connections have different ownership paths. Therefore reducing worker count, queue capacity or per-task payload can sometimes create more useful headroom than changing a collector flag. Which lever helps depends on the category actually growing.
Set budgets that can be enforced at boundaries: maximum input bytes, maximum queued jobs, bounded response aggregation and explicit ownership of buffers. The lab's platform-thread control changes only its stack allowance; it does not pretend to calculate the memory of all task objects. That omission is deliberate. Replace its fixed other-native and safety values with evidence and a documented policy before using a similar worksheet operationally.
Read the default deficit without treating it as a benchmark
The default inputs sum to 2,176 MiB: 1,536 heap, 128 direct, 128 platform-stack allowance, 256 other native and 128 safety allowance. Against 2,048 MiB, the planning deficit is 128 MiB. Lowering the heap allowance by 512 MiB changes the residual to positive 384 MiB. The Java example checks only that arithmetic; it does not allocate those budgets or cause a memory failure.
For an actual rollout, preserve a baseline, identify the enforced process limit and observe usage under representative load and failure conditions. Reconcile the planning envelope with the peak measurements without claiming equality between them. A positive worksheet margin does not prove safety when an unmodeled native library, payload spike or additional process shares the limit. Publish what was measured and retain the remaining uncertainty.
Run the Java boundary check
Use a JDK with Java 21 APIs or later. Save the original JvmBudgetDemo.java into an empty local directory. The example uses only the JDK and synthetic fixtures; no model, network service or credentials are required.
javac --release 21 JvmBudgetDemo.java
java -ea JvmBudgetDemo
// Author: Sandeep Belgavi. Hypothetical MiB planning arithmetic, not process measurement.
public class JvmBudgetDemo {
public static void main(String[] args) {
long limit = 2048, heap = 1536, direct = 128;
long platformThreads = 128, stackKiB = 1024, otherNative = 256, reserve = 128;
double stackMiB = platformThreads * stackKiB / 1024.0;
double planned = heap + direct + stackMiB + otherNative + reserve;
double headroom = limit - planned;
if (headroom != -128.0) throw new AssertionError("Arithmetic changed");
System.out.printf(java.util.Locale.ROOT,
"planned=%.1f MiB headroom=%.1f MiB budget_exceeded=%s%n",
planned, headroom, headroom < 0);
}
}
For a separate process you control, enable NMT at startup and replace PID with that exact process identifier. These commands are a diagnostic recipe, not output from this arithmetic exercise:
java -XX:NativeMemoryTracking=summary YourApplication
jcmd PID VM.native_memory baseline
jcmd PID VM.native_memory summary.diff scale=MB
Compatibility check: the examples were compiled with --release 21 and executed on local HotSpot JDK 23.0.2. This checks the demonstrated invariants on that runtime; it is not a JDK performance comparison. APIs and diagnostic descriptions are linked to the Java 25 documentation, accessed 30 October 2026. No preview API is required.
Try the companion browser lab
Open JVM memory budget: expose the non-heap shortfall. Predict whether a 2,048 MiB limit can accommodate the default allowances. Reduce the heap by 512 MiB, then increase the number of platform threads. Explain which quantities are estimates rather than measured resident memory.
Expected outcome: The default planning sum is 2,176 MiB: a 128 MiB deficit. Reducing heap allowance from 1,536 to 1,024 MiB leaves 384 MiB after all modeled allowances. These figures are arithmetic, not observed JVM consumption.
Scope: The categories are deliberately non-overlapping planning allowances. They are not a sum of NMT totals, RSS and direct-buffer counters, which can overlap. Stack allowance is for platform threads; virtual-thread stacks require different accounting. Committed pages, mappings, allocator behavior and third-party allocations are not simulated.
Primary sources and evidence limits
The scenarios, diagrams, arithmetic and code are original educational examples. Browser ticks are synthetic. Java fixture success is not evidence of production throughput, latency, memory use or model quality.
Views are my own and do not represent any employer, past or present.