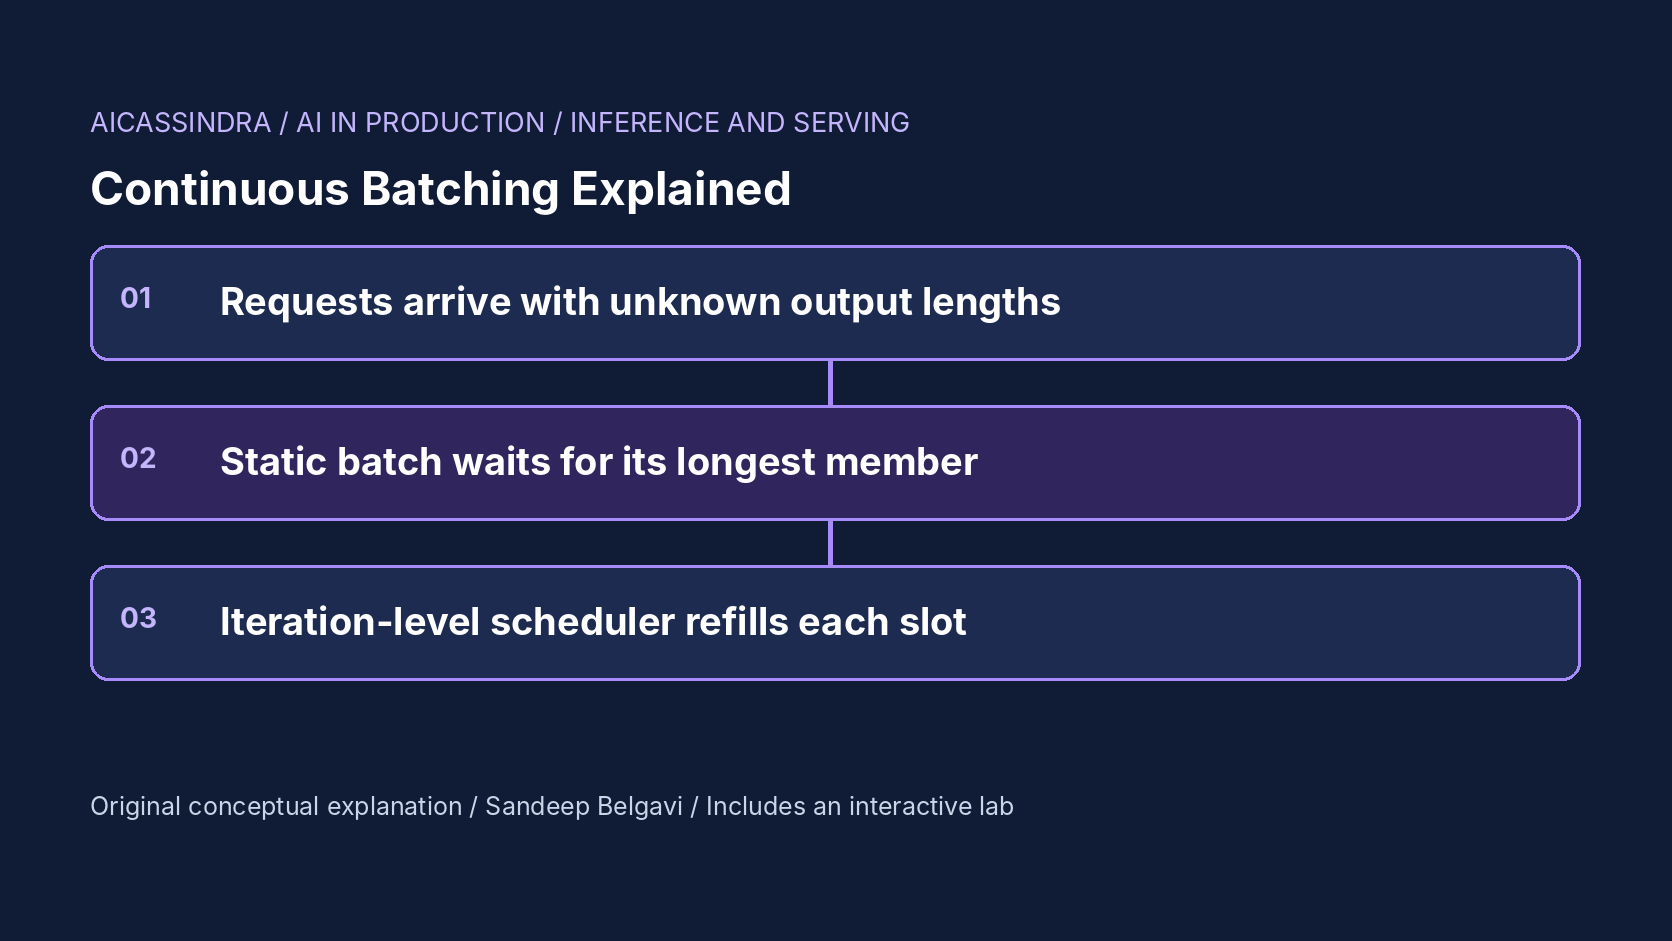
An LLM server spends most of its life in the decode loop: one forward pass produces one new token for every sequence in the batch. Batching is what makes that loop affordable, because the weights are read from memory once per step no matter how many sequences share it. The way you form the batch, though, decides whether a GPU that costs several dollars an hour is generating tokens or holding seats for requests that already finished.
This guide walks through the mechanism behind continuous batching (also called iteration-level or in-flight batching), the arithmetic that makes static batching wasteful for generative workloads, the new trade-off it introduces between throughput and per-token latency, and the knobs you actually tune in servers such as vLLM, SGLang, TGI and TensorRT-LLM. The embedded lab lets you schedule synthetic traffic and see each effect on a slot-by-slot timeline.
Static batching: the slot is held until the longest request ends
The obvious way to batch is the way you batch any inference workload: collect up to N requests (or wait up to T milliseconds), run them together, and return the results when the batch is done. For a classifier this is fine because every input costs the same. For generation it is a trap, because output length is unknown until the model emits an end-of-sequence token, and it varies wildly. In a chat workload the median answer might be 150 tokens while the 99th percentile is 1,500.
With request-level batching, a batch of 16 sequences runs until its longest member finishes. A sequence that ended at token 90 keeps its slot, and the GPU keeps computing padding for it (or masking it) for every remaining step. Meanwhile new requests queue up behind a batch that is mostly done. Two separate costs pile up:
- Padding waste: if output lengths are exponentially distributed with mean L, the longest of 16 is roughly L times the 16th harmonic number, about 3.4L. The batch then runs for 3.4L steps but only produces 16L useful tokens out of 54L slot-steps: under a third of the reserved capacity does useful work.
- Head-of-line blocking: a request that arrives one step after a batch starts waits for the entire batch to drain, then possibly for the fill timeout of the next one. Time to first token (TTFT) becomes a function of other people's output lengths.
Teams usually discover this as a capacity mystery: GPU utilization graphs look busy, yet throughput is a fraction of what the benchmark promised, and p95 TTFT explodes the moment traffic rises. In the lab, the default static setup shows the symptom as a sea of red cells: finished sequences that still hold a slot.
Iteration-level scheduling: decide the batch every step
The fix, introduced in the Orca paper (OSDI 2022) and now standard in production servers, is to make the scheduling decision at every iteration instead of every request. Before each decode step the scheduler looks at the running set: sequences that emitted end-of-sequence or hit their token limit leave immediately and their results stream back; waiting requests are admitted into the freed slots; then one step runs for whatever is in the batch.
Two details make this work in practice. First, the newly admitted requests need a prefill: their whole prompt has to be processed to build the KV cache before they can decode. Orca handled the mismatch with selective batching, running attention per sequence while sharing the dense layers. Modern servers either run the prefill as part of the same step (mixing prefill and decode tokens in one batch) or split long prompts into chunks so a single 30,000-token prompt cannot freeze everyone else's stream. Second, admitting a sequence is a commitment to hold its KV cache until it ends, so the scheduler has to know how much memory is free, which is why continuous batching and paged KV cache management (vLLM's PagedAttention) arrived together.
The pseudo-code is short; the hard parts are memory accounting and fairness:
while True:
    running = [s for s in running if not s.finished]      # finished sequences leave now
    while waiting and len(running) < max_num_seqs and kv_blocks_free(waiting[0]):
        seq = waiting.pop(0)
        running.append(seq)                                # admitted mid-flight
    step_tokens = schedule_prefill_chunks(running, budget=max_num_batched_tokens)
    outputs = model.forward(step_tokens)                   # one iteration for everyone
    for seq, token in outputs:
        seq.append(token)
        stream_to_client(seq, token)
Because each slot is refilled on the very next step, the padding waste disappears: in the lab, occupied slots that are decoding jumps from about 30% to essentially 100% for the same batch size, and the throughput of the same simulated GPU more than doubles at the same traffic.
The new trade-off: throughput versus time per output token
Continuous batching does not make batch size free. It moves the tension somewhere more visible. Once slots are always full, a larger maximum batch directly increases the duration of every decode step, which is the time each user waits between tokens. Serving teams track this as TPOT (time per output token) or ITL (inter-token latency). For a chat UI, anything under about 30 to 50 ms per token reads as smooth streaming; for a voice agent that turns text into speech the budget can be tighter, and for offline batch summarization it hardly matters.
That gives you three regimes to recognise:
| Regime | Symptom | What to change |
|---|---|---|
| Under-batched | Queue grows, TTFT climbs, TPOT is low | Raise max concurrent sequences or token budget; add replicas |
| Balanced | Queue near zero, TPOT inside SLO | Leave it; watch for traffic mix changes |
| Over-batched | Queue near zero, TPOT above SLO, streams stutter | Lower max batch, or scale out instead of up |
The third mission in the lab puts you in a saturated server and asks for at least 1,150 tokens per second while p95 TPOT stays at or under 16 ms. With the lab's step model there is exactly one band of batch sizes that satisfies both: below it throughput is too low, above it every stream stutters. Real servers have the same structure, which is why you should derive the batch limit from the latency SLO rather than from GPU memory alone.
Prefill interference and chunked prefill
Admitting a request mid-flight means its prompt has to be processed inside a step that also serves the running decoders. A 200-token prompt adds little. A 20,000-token retrieval-augmented prompt can turn a 12 ms decode step into a 400 ms one, and every user currently streaming sees a visible pause. This is prefill interference, and it is the main source of TPOT spikes in continuous-batching servers.
Chunked prefill bounds it: the scheduler gives each step a token budget (vLLM calls it max_num_batched_tokens) and splits long prompts across several steps, so each step does a bounded slice of prefill work alongside the decodes. Smaller chunks protect inter-token latency; larger chunks finish prompts sooner and improve TTFT for long-prompt requests. Sarathi-Serve popularised the approach, and disaggregated serving goes further by running prefill and decode on separate GPU pools entirely. In the lab, newly admitted sequences show as amber cells; watch how bursts of admissions coincide with slower steps.
The knobs in real servers
Every major server exposes the same handful of controls under different names. Treat these as the questions to answer, not values to copy:
| Concept | vLLM | TGI | What it bounds |
|---|---|---|---|
| Max concurrent sequences | --max-num-seqs | --max-concurrent-requests (admission) | Batch size, hence TPOT |
| Tokens per step | --max-num-batched-tokens | --max-batch-total-tokens, --max-batch-prefill-tokens | Prefill interference |
| Chunked prefill | --enable-chunked-prefill (default on in recent versions) | built in | Long-prompt stalls |
| KV memory share | --gpu-memory-utilization | derived from free memory | How many sequences fit |
| Max output length | max_tokens per request | max_new_tokens | Worst-case slot hold time |
Flag names and defaults change between releases, so check the documentation for the exact version you deploy. Two behaviours deserve particular attention. When KV memory runs out mid-generation, the scheduler must preempt a running sequence, either swapping its cache to CPU memory or discarding and recomputing it later; frequent preemption shows up as sudden latency cliffs. And when the queue is long, scheduling order matters: first-come-first-served is simple and fair, while priority classes let interactive traffic jump ahead of batch jobs sharing the same replica.
Measuring it honestly
Batching changes are easy to mis-measure because the effect depends on the traffic shape. A benchmark that sends 64 requests at once, all with 128-token outputs, flatters static batching (every sequence ends together) and hides the output-length variance that makes it wasteful in production. A more honest load test does four things:
- Replays a realistic distribution of prompt and output lengths, ideally sampled from your own logs with content removed.
- Uses open-loop arrivals (requests arrive on a schedule whether or not earlier ones finished) rather than a fixed number of concurrent clients, which silently throttles itself when the server slows down.
- Reports TTFT and TPOT percentiles separately, plus goodput: the share of requests that met both SLOs.
- Sweeps the arrival rate past saturation so you can see where the queue stops draining.
In the lab, the burst event models the most common production surprise: a doubling of traffic for a short window. Mission two asks for the smallest batch that keeps p95 TTFT under one second through a 2.5x burst. Notice that the answer depends on the burst and on output lengths, not on GPU memory alone.
A worked example: sizing one replica
Suppose a hypothetical assistant for Belgavi's Book Store answers catalog questions. Logs show a mean output of 200 tokens and a long tail, and the product team wants p95 TPOT under 16 ms so answers stream smoothly. With the lab's step model, a batch of 26 sequences takes 8 + 0.3 × 26 = 15.8 ms per step before any prefill, so the hard ceiling is about 26 concurrent sequences, and prefill spikes push the safe value lower, to around 16 to 20.
At 16 sequences and roughly 12.8 ms per step, one replica produces about 1,250 tokens per second when every slot is busy. Steady traffic of 4 requests per second needs 800 tokens per second, so the replica runs at about 64% of its decode capacity: comfortable headroom. A burst to 10 requests per second needs 2,000 tokens per second, which this replica cannot serve at the latency target, so the queue grows and TTFT climbs for as long as the burst lasts. The choice is then explicit: accept the TTFT hit during bursts, scale out to a second replica, or shed lower-priority traffic. Raising the batch limit is not on the list, because it would break the TPOT target for every user to rescue the few who are waiting.
Every number here is illustrative, but the procedure transfers directly: derive the batch ceiling from the per-token SLO, derive replica capacity from the ceiling, and compare it with peak demand rather than average demand.
Common mistakes
Most batching incidents trace back to a short list of errors. Copying another team's max-num-seqs without their traffic mix is the classic one: a value that is ideal for 100-token chat answers will produce stuttering streams for a code assistant that writes 800-token completions. Treating GPU utilization as a capacity signal is the second: a GPU running a padded static batch can show 100% utilization while doing under a third of the useful work. Third, leaving max_tokens unbounded lets a single runaway generation hold a slot and its KV blocks for minutes. Finally, load-testing with closed-loop clients hides queueing entirely, so the first time anyone sees the TTFT cliff is during a real traffic spike.
Run the lab: Static vs continuous batching: fill the GPU without stalls
The lab below simulates sixty seconds of synthetic traffic on one GPU using the linear step model from earlier. Each column of the timeline is one decode step and each row is a batch slot: blue cells generate a token, amber cells were admitted on that step, and red cells are finished sequences still holding a slot. Start with the static scheduler, then work through the missions; each one loads a broken setup and asks you to fix it the way you would on a real server.
Prefer a full-width view? Open the standalone lab. Your stars are saved in this browser and shown on the series hub.
What to do next
- Confirm your server uses iteration-level batching and find the exact flag names for max concurrent sequences and the per-step token budget in the version you run.
- Pull a week of prompt and output token lengths from logs and record the median, p95 and p99 of each; size max_tokens from that distribution.
- Load-test with open-loop arrivals at three rates (normal, 2x, past saturation) and record p95 TTFT, p95 TPOT and goodput at each.
- Set the batch limit from your TPOT SLO: increase it until p95 TPOT approaches the budget, then back off by a safety margin.
- Enable chunked prefill if long prompts are common, and alert on TPOT spikes rather than average GPU utilization.
- Watch preemption counters; sustained preemption means KV memory, not compute, is your bottleneck.
Sources and further reading
- Orca: A Distributed Serving System for Transformer-Based Generative Models (OSDI 2022)
- Efficient Memory Management for Large Language Model Serving with PagedAttention (SOSP 2023)
- Taming Throughput-Latency Tradeoff in LLM Inference with Sarathi-Serve (OSDI 2024)
- vLLM documentation: engine arguments
- Hugging Face Text Generation Inference: launcher arguments
Related in this series:
- PagedAttention Block Tables: How vLLM Ends KV Cache Fragmentation
- Chunked Prefill: Stopping Long Prompts From Freezing Every Other Stream
- TTFT, TPOT and Goodput: Setting LLM Latency SLOs That Mean Something
Diagrams, examples and the lab model are original educational material. Lab numbers are calculated by a synthetic model, not measured on real hardware or services.
Views are my own and do not represent any employer, past or present.