An LLM serving dashboard can show a healthy GPU, a steady 3,000 tokens per second and a mean time to first token of 400 ms while half the users stare at a spinner. Throughput counts work done, not work that arrived in time, and a mean blends the request that started streaming in 80 ms with the one that waited nine seconds in a queue. When a product team says the assistant feels slow, neither number explains why.
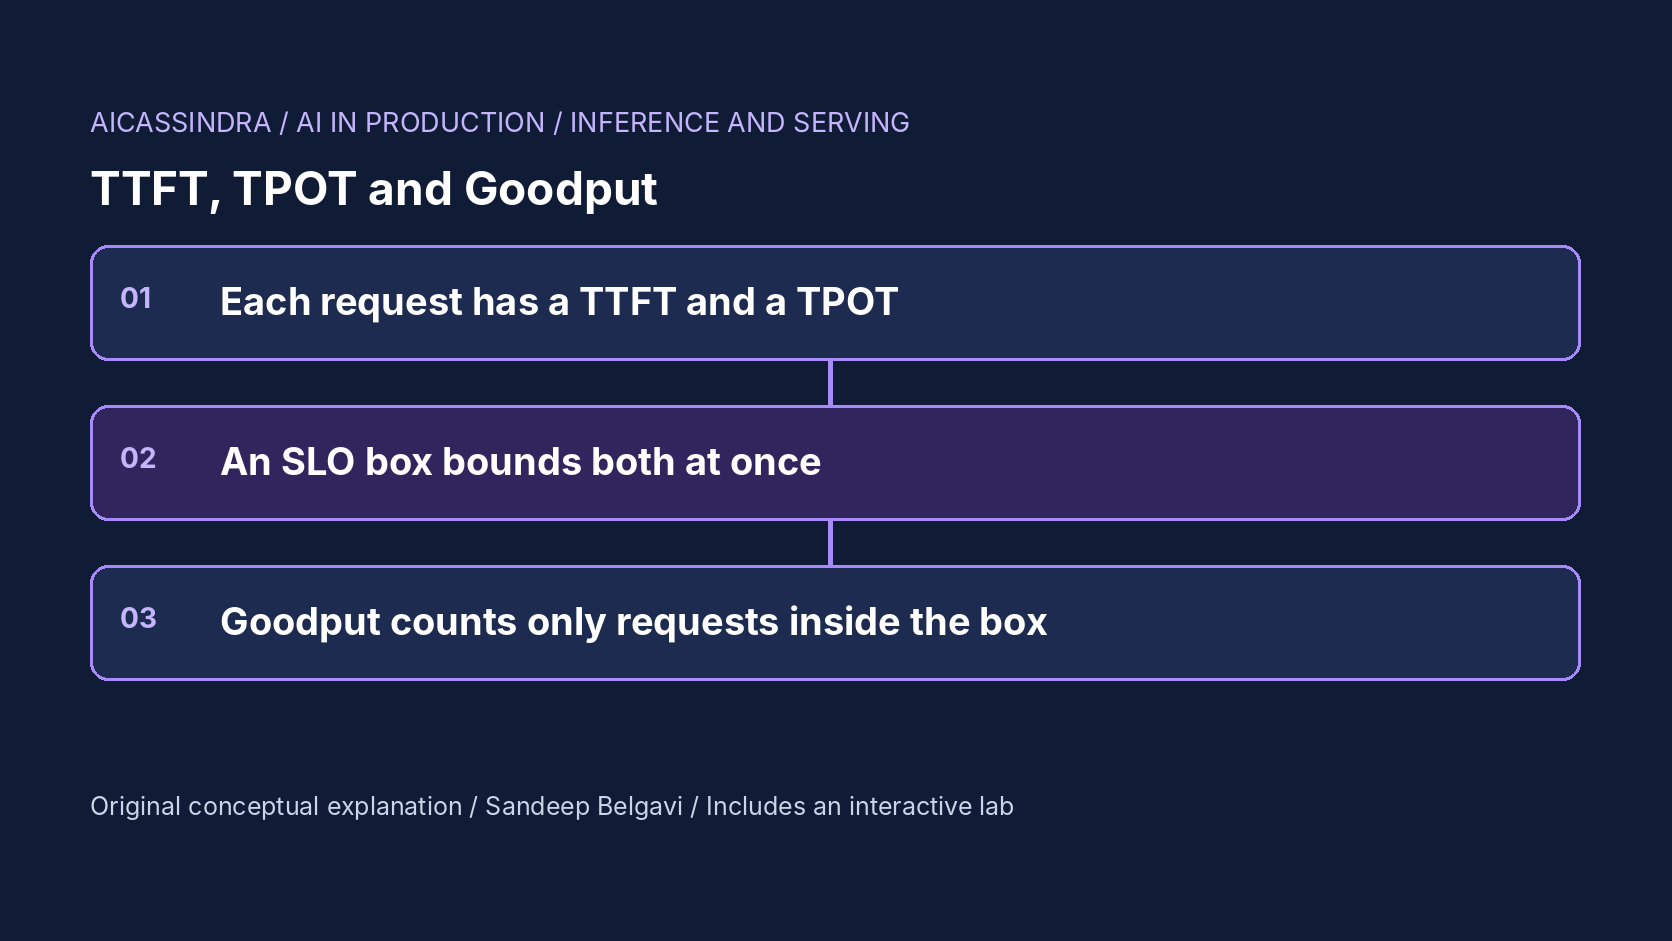
This guide defines the latency numbers that matter for streamed generation (time to first token, time per output token, inter-token latency and end-to-end latency), shows how to turn them into service level objectives that describe a user's experience, and builds up to goodput: the rate of requests that met every SLO at once. It works through the queueing and step-time arithmetic behind each number, the knobs in vLLM, SGLang, TGI and TensorRT-LLM that move them, and how to measure goodput honestly. The embedded lab plots every synthetic request as a dot against an SLO box so you can see which constraint is binding.
Why throughput and averages mislead
Throughput is a supply-side number: how many tokens or requests the server produced per second. It says nothing about whether those tokens arrived when a user was still waiting for them. A server that queues requests for ten seconds and then decodes them efficiently can post excellent throughput; so can a server that packs 128 sequences into every step and streams each of them at a stuttering 45 ms per token. Both are busy. Neither is good.
Means fail for a different reason. LLM latency distributions are long-tailed and often bimodal: requests that found a free slot start in tens of milliseconds, requests that queued start in seconds. A mean TTFT of 400 ms is consistent with 90% of users at 100 ms and 10% at 3 s. Percentiles are better but still incomplete, because a p95 TTFT and a p95 TPOT are computed over different orderings of requests. The 5% of requests with the worst TTFT are not necessarily the 5% with the worst TPOT, so meeting both p95 targets can still leave close to 10% of users with at least one bad experience.
The fix is to evaluate SLOs per request and count: did this request meet its TTFT target and its TPOT target? The share that did is SLO attainment; attainment multiplied by the arrival rate is goodput. That single number moves when anything a user can feel gets worse, and it does not move when the GPU merely gets busier.
The four latency numbers for streamed generation
Streaming splits one request into two phases with different physics. Prefill processes the whole prompt in parallel and produces the first token; decode produces one token per forward pass after that. Each phase gets its own metric:
| Metric | Definition | What a user feels | Dominated by |
|---|---|---|---|
| TTFT (time to first token) | First streamed token time minus request arrival time | How long the spinner shows | Queueing, prompt length, prefill scheduling |
| TPOT (time per output token) | (Last token time minus first token time) divided by (output tokens minus 1), per request | Average reading speed of the stream | Batch size per decode step, co-scheduled prefill |
| ITL (inter-token latency) | Each individual gap between consecutive tokens | Stalls and stutter mid-answer | Large prefill chunks, preemption, stragglers |
| E2E latency | Last token time minus arrival time | Total wait for non-streamed or tool-call use | TTFT + TPOT × (output tokens minus 1) |
TPOT and ITL are often confused. TPOT is a per-request mean, so a request that hits one 300 ms stall among 300 tokens of 15 ms barely moves (its TPOT rises by about 1 ms). The user still sees a visible freeze. If stalls matter to your product, add an ITL bound such as "p99 gap per request under 150 ms" alongside TPOT. Benchmark tools also differ on whether TPOT includes the first token and how they handle single-token outputs, so check the definitions in whatever tool you use before comparing numbers across teams.
Which numbers belong in the SLO depends on the product. A chat interface needs a TTFT bound (people tolerate about a second before the answer starts) and a TPOT bound near human reading speed: 40 ms per token is roughly 25 tokens per second, faster than most people read. A voice agent that feeds text to speech synthesis needs a tighter TTFT, because silence on a call is obvious, and a TPOT faster than speech. An agent that calls tools and reads the full output cares about end-to-end latency only. Offline summarisation may need no latency SLO at all, only a deadline for the whole batch.
Goodput: counting requests inside the SLO box
DistServe (OSDI 2024) made the term popular in LLM serving: goodput is the maximum request rate a system can sustain while a target fraction of requests (for example 90%) meets both the TTFT and the TPOT objectives. Operationally there are two closely related views. As a capacity figure, it is the highest arrival rate at which attainment stays above target. As a live metric, it is the rate of completed requests that met every SLO, which you can graph next to raw completions.
The joint condition is the important part. If TTFT and TPOT misses were independent and each SLO were met by 95% of requests, joint attainment would be 0.95 × 0.95 = 90.25%. In practice they are correlated, sometimes positively (an overloaded replica is slow at everything) and sometimes negatively (a larger batch cuts queueing, which helps TTFT, but slows every decode step, which hurts TPOT). That negative correlation is why tuning against one percentile at a time oscillates: each fix for one SLO spends the budget of the other.
Goodput also gives cost a sensible denominator. Cost per thousand requests rewards a server that answers everything late. Cost per thousand good requests does not:
cost_per_1k_good = replicas * gpu_price_per_hour / 3600 / goodput_rps * 1000

# illustrative: 2 replicas at $4/GPU-hour
# raw 11.5 req/s, attainment 51%  -> goodput 5.9 req/s -> $0.38 per 1k good
# raw 12.0 req/s, attainment 96%  -> goodput 11.5 req/s -> $0.19 per 1k good
Same hardware, almost the same raw throughput, half the effective cost. The difference is entirely whether the work landed inside the SLO.
Where the time goes: queueing, prefill and decode
Each SLO has a distinct mechanism behind it, and the arithmetic is simple enough to do on a whiteboard. The lab uses a step model that captures the essential shape: a decode step is memory-bandwidth bound and costs a fixed amount plus a little per sequence, while prefill is compute bound and costs per prompt token. When a step carries both, the GPU does whichever is slower, because spare compute in a memory-bound decode step can absorb some prefill for free:
# illustrative constants used in the lab, not a benchmark
decode_ms  = 6 + 0.25 * decoding_sequences
prefill_ms = 2 + 0.02 * prefill_tokens_in_step
step_ms    = max(decode_ms, prefill_ms)

# 52 decoding sequences: decode_ms = 19 ms
# prefill hidden under decode while 2 + 0.02 * tokens <= 19  ->  up to ~850 tokens per step
# a 16,000-token prompt in one step: 322 ms, every stream in that step freezes
TTFT is queueing time plus prefill time. Queueing follows Little's law: the number of requests in the system equals arrival rate times time in the system. With 12 requests per second, a mean of 220 output tokens and about 19 ms per step, each request decodes for roughly 220 × 0.019 = 4.2 s, so about 12 × 4.2 ≈ 50 sequences are in flight on average. Cap concurrency at 32 and the excess waits in the queue, which grows until arrivals slow down. TTFT goes from tens of milliseconds to tens of seconds while the GPU stays fully busy and TPOT actually improves. That is the first lab mission.
TPOT is the average step time a request experiences while decoding. It rises with the number of sequences sharing each step (0.25 ms each in the model) and with any prefill large enough to escape the decode shadow. With 64 sequences the decode step is 22 ms; a 40 ms TPOT SLO leaves plenty of room. With 128 sequences it is 38 ms and any prefill spike pushes it over.
ITL stalls come from the step that carries a big prefill chunk. Chunked prefill (Sarathi-Serve, now standard in vLLM and others) caps the prompt tokens per step, so a long prompt is spread over many steps that each hide under decode time. Chunk too small, though, and prefill throughput drops below demand: prompts queue for prefill and TTFT climbs. The per-step token budget is a genuine two-sided knob.
The knobs that move each SLO
Every serving engine exposes the same handful of controls. Names below are from recent releases; flags and defaults change frequently, so check your version's documentation before relying on them.
| Knob | vLLM | Other engines | Raises | Lowers |
|---|---|---|---|---|
| Max concurrent sequences | --max-num-seqs | SGLang --max-running-requests; TGI --max-concurrent-requests (admission limit) | TPOT when high | TTFT queueing when high |
| Tokens per step | --max-num-batched-tokens | SGLang --chunked-prefill-size; TGI --max-batch-prefill-tokens | ITL stalls and TPOT when high | TTFT for long prompts when high |
| Chunked prefill | --enable-chunked-prefill (default on in recent V1 releases) | TensorRT-LLM context chunking option | Nothing directly | Long-prompt stalls |
| Replicas and routing | Outside the engine | Kubernetes, gateway, load balancer | Cost | All SLOs under load |
| Max output tokens | max_tokens per request | max_new_tokens | E2E for long answers | Slot hold time |
Beyond these, disaggregated serving (DistServe, Splitwise) puts prefill and decode on separate GPU pools so each phase can be sized against its own SLO, at the cost of transferring KV cache between them. Priority scheduling lets interactive traffic jump batch traffic on the same replica. Speculative decoding lowers TPOT at low batch sizes but its benefit shrinks as batches grow, so measure it against your goodput target rather than single-stream latency.
A worked example: Belgavi's Book Store assistant
Suppose the hypothetical Belgavi's Book Store runs a catalogue assistant. The product team writes the SLO as user experience first, then numbers: "the answer starts within a second and streams faster than people read, for 99% of requests over a rolling 28 days." That becomes TTFT ≤ 1.0 s and TPOT ≤ 40 ms, evaluated per request, with a 99% attainment objective and therefore a 1% error budget.
Logs show a mean of 220 output tokens and prompts of 300 to 1,700 tokens. Peak traffic is 15 requests per second, doubling for short bursts after a newsletter goes out. Using the lab's step model (illustrative, not measured): at about 50 in-flight sequences per replica, steps take roughly 18 to 20 ms, comfortably under the 40 ms TPOT bound, so the binding constraint at peak is TTFT, which depends on whether there is a free slot. One replica at 15 req/s needs about 15 × 220 × 0.02 ≈ 66 sequences in flight, and the step time at 66 sequences is 22.5 ms, still inside TPOT. Queueing variance pushes the useful cap comfortably above that average, to around 96 in the lab, not the 32 a conservative operator might pick.
During a 2x burst, two replicas with a cap of 48 sequences each fall to under 60% attainment in the lab: the cap, not the GPUs, is the bottleneck. Raising the cap to 96 lets each replica absorb the burst while p95 TPOT stays around 26 ms, below the 30 ms bound used in that mission. A third replica also works, at 50% more cost. The point is not the specific numbers; it is that the cheapest fix was found by looking at which SLO was binding and how much headroom the other one had.
The error budget then governs operations. At 15 req/s, a 1% budget over 28 days is roughly 360,000 requests allowed to miss. A bad deployment that drops attainment to 50% for one hour burns about 27,000 of them, roughly 7% of the month's budget in an hour, which is the kind of number that makes a rollback decision easy.
Measuring goodput in production
Measure at the edge closest to the user. Server-side histograms (vLLM exports TTFT and per-output-token histograms on its Prometheus endpoint, under names that have changed between versions) miss time spent in the gateway, the network and any client-side buffering. A gateway or client SDK that timestamps arrival, first byte and last byte per request is the ground truth. Keep the token count with each record so TPOT can be computed per request.
SLO = {"ttft_s": 1.0, "tpot_ms": 40.0}

def met_slo(r):
    if r.status != "ok" or r.first_token_at is None:
        return False                      # errors and timeouts are misses, not exclusions
    ttft = r.first_token_at - r.arrived_at
    tpot = 0.0 if r.out_tokens <= 1 else (r.last_token_at - r.first_token_at) / (r.out_tokens - 1)
    return ttft <= SLO["ttft_s"] and tpot * 1000 <= SLO["tpot_ms"]

def goodput(records, window_s):
    good = sum(met_slo(r) for r in records)
    return good / window_s, good / max(1, len(records))   # (good req/s, attainment)
Three details decide whether the number is honest. First, failures, timeouts and client cancellations count as misses; filtering them out makes attainment rise exactly when things are worst. Second, attainment needs a minimum sample per window, or a quiet hour with three requests can read 100% or 0%. Third, load tests must use open-loop arrivals at a fixed rate. Closed-loop clients wait for each response before sending the next one, so an overloaded server automatically receives less traffic and the queueing that destroys TTFT never appears. vLLM's serving benchmark accepts goodput SLO thresholds directly (a --goodput option taking TTFT, TPOT and E2E limits in milliseconds in recent versions); check your version's help text for the exact syntax.
For alerting, use burn rate on the error budget rather than raw thresholds: alert when the last hour consumes the budget many times faster than the monthly rate allows, and confirm with a shorter window to avoid flapping. Break attainment down by which SLO failed. A TTFT-only miss points at queueing or prefill scheduling, a TPOT-only miss at batch size or chunk size, and both at once at overload.
Failure modes and common mistakes
- Reporting p95 of each metric and calling it the SLO. Joint attainment can be several points lower. Compute the per-request conjunction.
- Sizing concurrency from GPU memory alone. KV capacity sets the ceiling; the TPOT SLO and Little's law set the useful range. A cap below demand shows as a TTFT cliff with a calm TPOT graph.
- Turning off chunking, or using huge chunks, for throughput. Benchmarks with short prompts will not show the cost. The first long retrieval prompt in production stalls every stream sharing the step.
- Averaging across traffic classes. A 2,000-token report generator and a 100-token chat reply should not share one TPOT bound or one attainment number. Give each class its own SLO and goodput.
- Ignoring prompt growth. Multi-turn chats and RAG features lengthen prompts over weeks. TTFT degrades slowly, so track p95 prompt tokens alongside attainment.
- Counting goodput on the server only. Gateway retries, TLS and client buffering add latency the engine never sees.
How the lab connects to this
The lab simulates one minute of synthetic traffic on one to six replicas with round-robin routing, using the step model above. Every request becomes a dot: horizontal position is its TTFT, vertical position its TPOT, and the shaded box is the SLO. Green dots are goodput. The bars beside the plot show attainment per SLO and jointly, and the step-time strip shows prefill-carrying steps in amber.
Mission one starts with a concurrency cap of 32 at 12 requests per second: TPOT is excellent and the GPU is busy, yet most requests miss TTFT. Mission two turns on long RAG prompts with chunking effectively disabled and asks you to restore 95% attainment on one replica, which requires finding a chunk size that is neither too large (stalls) nor too small (prefill backlog). Mission three doubles traffic for twenty seconds and rewards you for absorbing the burst by spending TPOT headroom instead of buying a replica. Mission four combines a voice-style SLO with long prompts and a cost ceiling, so you have to balance TTFT, TPOT and dollars at once.
Run the lab: Goodput: count only the requests that met their SLO
Each dot below is one synthetic request plotted by its time to first token and time per output token; the shaded box is the SLO and green dots count toward goodput. Start by moving the concurrency and chunk sliders on the default setup, then load mission one and work through the four broken configurations.
Prefer a full-width view? Open the standalone lab. Your stars are saved in this browser and shown on the series hub.
What to do next
- Write your latency SLO per traffic class as a per-request conjunction (TTFT and TPOT, plus an ITL bound if stalls matter) with an attainment target and window.
- Log arrival, first-token and last-token timestamps plus output token count per request at the gateway, and compute attainment and goodput from those records.
- Count errors, timeouts and cancellations as SLO misses, and break attainment down by which SLO failed.
- Use Little's law with your peak rate and mean decode time to check that the concurrency cap exceeds expected in-flight sequences.
- Load-test with open-loop arrivals at normal, burst and past-saturation rates, including your longest realistic prompts, and record goodput at each.
- Replace cost per request with cost per thousand good requests in capacity reviews.
- Set burn-rate alerts on the attainment error budget rather than static p95 thresholds.
Sources and further reading
- DistServe: Disaggregating Prefill and Decoding for Goodput-optimized Large Language Model Serving (OSDI 2024)
- Taming Throughput-Latency Tradeoff in LLM Inference with Sarathi-Serve (OSDI 2024)
- Splitwise: Efficient Generative LLM Inference Using Phase Splitting (ISCA 2024)
- Google SRE book: Service Level Objectives
- vLLM documentation: engine arguments
Related in this series:
- Continuous Batching Explained: Why Static Batches Leave GPUs Idle
- Chunked Prefill: Stopping Long Prompts From Freezing Every Other Stream
- Autoscaling LLM Servers: Why GPU Utilization Lies and Queue Depth Wins
Diagrams, examples and the lab model are original educational material. Lab numbers are calculated by a synthetic model, not measured on real hardware or services.
Views are my own and do not represent any employer, past or present.