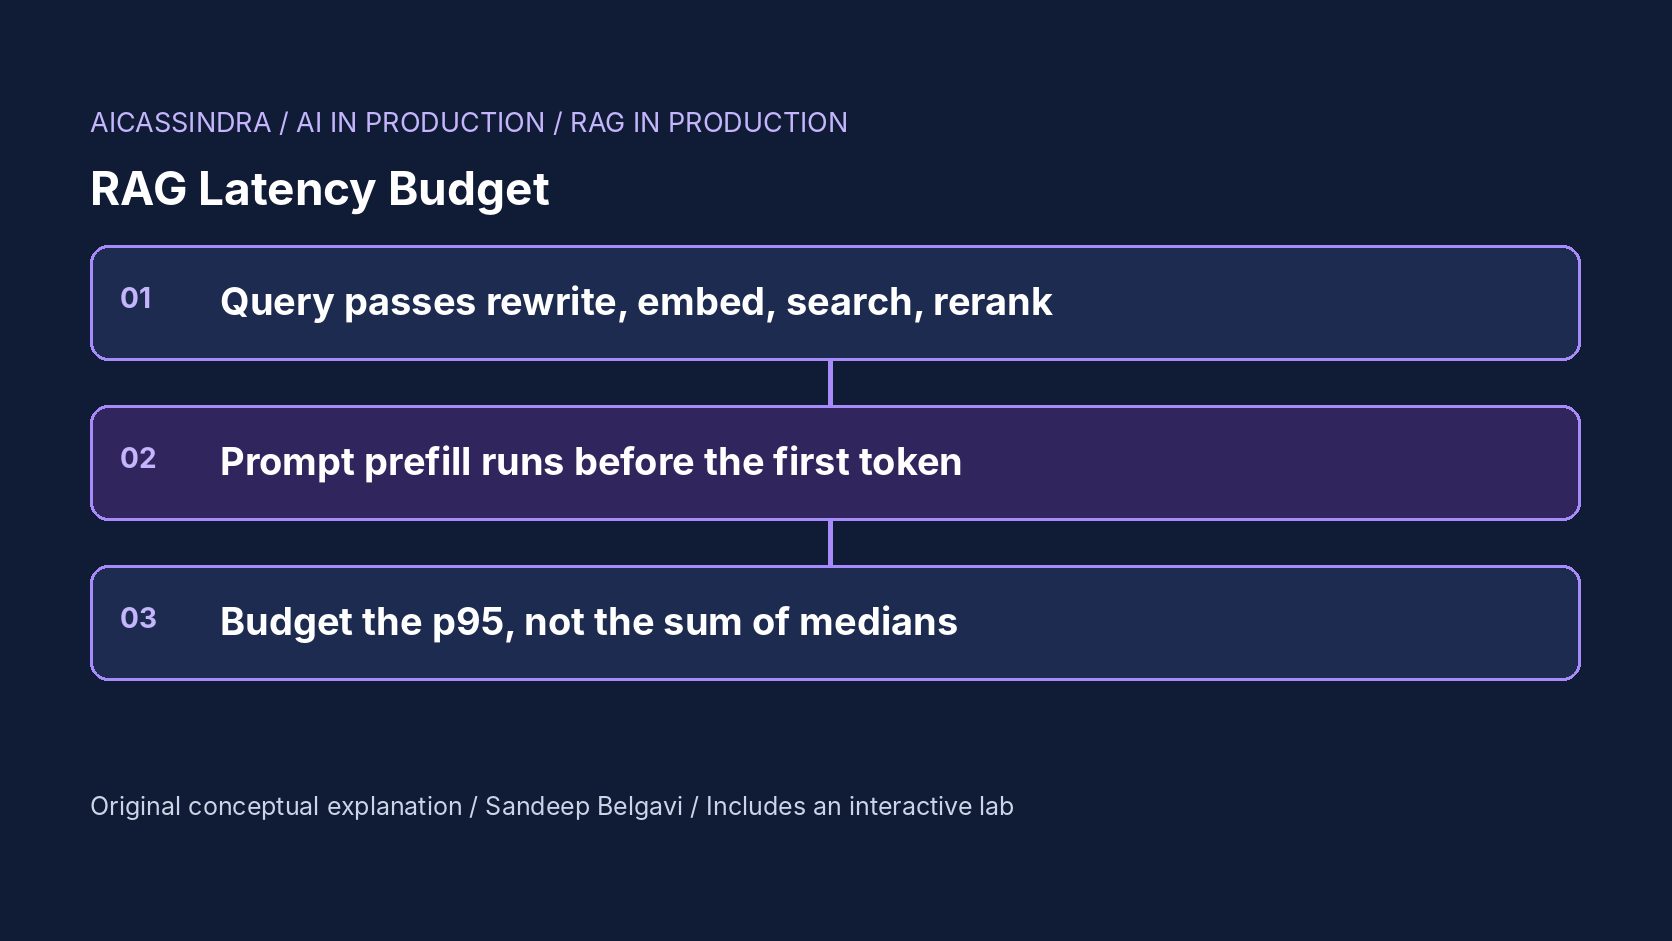
A RAG request is a small distributed system. Before the model writes a single token, the query may be rewritten by an LLM, embedded by a hosted API, sent to a vector index and a keyword index, reranked by a cross-encoder, and packed into a prompt that the model has to prefill. Each stage looks cheap on its own dashboard. Together they decide whether the user sees the first word after 400 milliseconds or after two seconds, and the slowest few percent of requests are usually slow for a reason that no single stage's median reveals.
This guide breaks a RAG request into stages, shows the arithmetic of how stage latencies add up (and why percentiles do not add), explains which knobs move time to first token most (query rewriting, retrieval fan-out, rerank depth and batch size, prompt size), covers tail-latency techniques such as hedged requests, and gives a procedure for setting a per-stage budget. The embedded lab simulates 1,000 synthetic requests through a configurable pipeline so you can watch the waterfall and the distribution move together.
Anatomy of a RAG request
For a chat-style RAG answer, the latency users feel is time to first token (TTFT): the gap between pressing enter and the first word appearing. Everything before generation starts sits on that critical path. A typical pipeline, with illustrative median latencies of the kind used in the lab:
| Stage | What runs | Illustrative median | What makes it slow |
|---|---|---|---|
| Query rewrite (optional) | An LLM call that rewrites or expands the query | 280 ms | It is a full generation; tail follows the LLM endpoint |
| Query embedding | Embedding model, often a hosted API | 35 ms (API), 7 ms (local GPU) | Network hop, provider congestion, cold starts |
| Vector search | Approximate nearest neighbour search (for example HNSW) | 12 ms | Large efSearch, filters, cold index pages |
| Keyword search (hybrid) | BM25 over an inverted index | 18 ms | Long queries, large shards |
| Rerank | Cross-encoder scoring of N candidates, in GPU batches | 22 ms per batch of 32 | Depth N, shared GPU, long passages |
| Prefill to first token | The LLM processes the whole prompt, then emits a token | 110 ms plus about 1 ms per 12 prompt tokens | Prompt length, queueing, batch contention |
The numbers are calculated for the lab, not measured, and your stack will differ. What transfers is the structure: a mix of network calls with heavy tails, GPU work that scales with how much you ask for, and one LLM prefill whose cost is proportional to how much context you send.
Percentiles do not add
It is tempting to set a budget by adding stage medians, or worse, stage p95s. Neither gives the request p95. For independent stages the median of the sum is roughly the sum of medians, but the p95 of the sum is less than the sum of the p95s, because it is unlikely that every stage is slow on the same request. Adding p95s overstates the budget and hides where the real tail comes from.
The opposite effect hurts more. When one stage has a rare but large delay, it dominates the request tail even if its median is tiny. Suppose 8% of embedding calls take an extra 350 to 750 ms because the provider is congested. The embedding median barely moves, but 8% of requests are now at least 350 ms slower, which is more than the 5% that p95 tolerates, so request p95 jumps by about the size of that delay. In the lab this moves p95 TTFT from about 560 ms to about 970 ms while p50 moves by only a few milliseconds.
Fan-out multiplies the problem. If a request depends on n independent calls and each is slow with probability p, the request is slow with probability 1 − (1 − p)^n. With five calls each slow 1% of the time, about 4.9% of requests hit at least one slow call: right at the p95 boundary. This is the core argument of Dean and Barroso's The Tail at Scale, and it applies to RAG pipelines as much as to web search.
# illustrative: why one rare slow dependency owns the p95
P(slow embedding)            = 0.08
P(request has a slow stage)  ~ 0.08          -> above 0.05, so p95 includes it
after hedging at the p90 mark:
P(both attempts slow)        = 0.08 * 0.08 = 0.0064   -> below 0.05, p95 recovers
p99 still sees the rare double-slow requests
Where to spend the budget
Start from the user-facing target and work backwards. If the product wants p95 TTFT under 800 ms, and the LLM endpoint itself needs 250 to 450 ms for a prompt of your typical size, then everything before generation has roughly 350 to 500 ms at p95, including network hops between services. That number, not a wish list of features, decides which stages you can afford.
- Query rewriting is the most expensive optional stage because it is an entire LLM generation placed before retrieval can start. It helps vague and conversational queries, so gate it: run it only when a cheap classifier or heuristic flags the query, or run it in parallel with a first search on the raw query and merge the results.
- Hybrid retrieval improves recall cheaply, but only if dense and keyword search run concurrently. Run serially, it adds the keyword latency to every request for no reason. Elasticsearch, OpenSearch, Qdrant and others can fuse results server-side (for example with reciprocal rank fusion); check your version's documentation for whether the sub-queries actually execute in parallel.
- Rerank depth has a staircase cost. Cross-encoders score candidates in GPU batches, so 33 candidates can cost nearly as much as 64, and 200 candidates cost seven batches. Measure recall at different depths; in many systems the needed passage is almost always within the first few dozen candidates.
- Prompt size drives prefill. Every chunk you add is processed before the first output token, so going from 12 chunks to 5 at 300 tokens each saves about 2,100 prompt tokens, which at an illustrative 12,000 tokens per second is around 175 ms per request, plus the input-token cost.
Time to first token is not the whole story. After the first token, the answer streams at the decode rate: at an illustrative 18 ms per token, a 250-token answer takes another 4.5 seconds to finish. Users tolerate that well when text is streaming, because they are reading, but any step that needs the complete answer (citation verification, a safety check on the full text, a structured-output parser) moves the effective latency from first token to last. Decide per surface which number you budget. For chat, budget TTFT and inter-token latency; for API consumers that wait for a complete JSON response, budget end-to-end latency and keep outputs short with an explicit maximum token limit.
Tail-tolerant techniques
Some latency cannot be removed, only hidden. Three techniques are worth knowing.
Hedged requests. If a call has not returned by the time most calls normally have (for example its p90 or p95), send a second identical request and use whichever answers first. Because slow calls are usually slow for transient reasons (a busy replica, a congested link), the second attempt rarely suffers the same delay. The cost is a few percent of extra calls. It only makes sense for idempotent, cheap calls such as embedding and search, never for calls with side effects or for expensive LLM generations without a budget.
Timeouts with fallbacks. Give each optional stage a deadline and a degraded path. If the rewrite has not returned in 300 ms, search with the raw query. If the reranker misses its deadline, use the fused first-stage ranking. A slightly worse answer on time is usually better than a better answer late, and it keeps one degraded dependency from taking the whole service with it.
Removing hops. A hosted embedding API adds a network round trip and a dependency on someone else's capacity. Running a small embedding model on the same GPU host as the reranker removes both, at the cost of operating it yourself. Similarly, co-locating the vector index with the application avoids cross-region hops that silently add tens of milliseconds.
Instrumenting the pipeline
You cannot budget what you cannot see. Emit one trace per request with a span per stage, using the same trace ID across services. OpenTelemetry has semantic conventions for generative AI spans (model name, token counts) that make LLM calls comparable with the rest of the trace; check the current status of those conventions, as they have been evolving. Most serving engines, including vLLM and Text Generation Inference, export TTFT and queue-time histograms; scrape them, but keep your own end-to-end measurement from the client side, because server-side TTFT does not include your retrieval stages or network time.
with tracer.start_as_current_span("rag.request") as root:
    with tracer.start_as_current_span("rag.rewrite"):  q = maybe_rewrite(query, deadline_ms=300)
    with tracer.start_as_current_span("rag.embed"):    v = hedged(embed, q, hedge_after_ms=70)
    with tracer.start_as_current_span("rag.retrieve"): hits = gather(dense(v, k=50), bm25(q, k=50))  # parallel
    with tracer.start_as_current_span("rag.rerank"):   top = rerank(q, fuse(hits)[:32], deadline_ms=120)
    with tracer.start_as_current_span("rag.generate") as g:
        stream = llm.generate(build_prompt(q, top[:5]), stream=True)
        first = next(stream); g.set_attribute("ttft_ms", elapsed_ms(root))
From these spans, build three views: a waterfall of slow requests (the lab draws one), stage p95s over time, and the share of requests in which each stage was the largest contributor. The last view answers the question that matters during an incident: which stage is responsible for the tail right now?
A worked example: Belgavi's Book Store
Suppose the hypothetical Belgavi's Book Store assistant launched with every feature enabled: LLM query rewriting, a hosted embedding API, hybrid search run serially, a reranker over 200 candidates and 12 chunks in the prompt. The lab's synthetic model gives these calculated numbers:
| Setup | p50 TTFT | p95 TTFT | Expected quality | Cost per 1k |
|---|---|---|---|---|
| Everything on | 972 ms | 1,331 ms | 85.6% | $19.25 |
| No rewrite, parallel hybrid, rerank 50 | 551 ms | 662 ms | 85.3% | $16.25 |
| Same, 5 chunks instead of 12 | 376 ms | 487 ms | 88.8% | $9.95 |
| Same, during an embedding API incident | about 460 ms | about 970 ms | unchanged | unchanged |
| Incident, with hedged embedding calls | about 460 ms | about 580 ms | unchanged | about the same |
Three lessons stand out. Removing the rewrite and parallelising retrieval halved p95 with almost no quality loss, because the reranker already recovers most of what the rewrite was buying. Cutting chunks from 12 to 5 improved quality as well as latency: with a good reranker, the extra chunks were distractors. And the incident row shows why tail techniques matter: the median barely moved while p95 doubled, and hedging recovered most of it. Every number is from a synthetic model; run the same comparison on your own traces before changing production.
Failure modes and common mistakes
The recurring latency incidents in RAG systems are mostly self-inflicted:
- Serial calls that could be parallel. Dense and keyword retrieval, permission lookups and metadata fetches written as sequential awaits. Each adds its full latency to every request.
- No deadline on optional stages. A rewrite or rerank with no timeout makes the whole request as slow as the slowest optional call.
- Batch sizes chosen by accident. A reranker that receives 33 candidates when its batch size is 32 pays for two batches. Align depth with batch size, or let the reranker server batch across requests.
- Shared GPUs without isolation. A reranker co-located with a training or batch job can slow by several times during the other job's peaks. Watch rerank p95 alongside GPU utilisation from other tenants.
- Prompts that grow silently. A new document type with longer chunks, a longer system prompt or extra few-shot examples raises prefill for every request. Alert on prompt-token percentiles, not just latency.
- Measuring averages. Mean latency hides exactly the requests users complain about. Budget and alert on p95 and p99, broken down by stage.
Playing the lab
The lab turns this into four missions. Mission one starts with every feature enabled and asks you to bring p95 TTFT under 800 ms without dropping quality: the waterfall shows which stages are serial and which are oversized. Mission two injects a congested embedding provider and fixes retrieval depth, so the only levers are hedging the call or removing the network hop. Mission three starts from a fast but low-quality pipeline and asks for higher quality inside a 500 ms p95, which means spending a little on a shallow rerank instead of a lot on more chunks. Mission four adds long chunks and a shared GPU at the same time; watch how rerank depth moves in steps of one batch and how each extra chunk now costs twice the prefill. The histogram under the waterfall shows the whole distribution, so you can see the tail move separately from the median.
Run the lab: RAG latency budget: find the milliseconds before the first token
The lab below sends 1,000 synthetic requests through a RAG pipeline you configure. The waterfall at the top replays one request from the slow half of the distribution, stage by stage, with the current p95 marked; the histogram underneath shows time to first token for every request with p50 and p95 lines. Quality is the chance that the needed passage lands in the prompt, discounted slightly for each extra chunk. Start with mission one and read the waterfall from left to right.
Prefer a full-width view? Open the standalone lab. Your stars are saved in this browser and shown on the series hub.
What to do next
- Add a trace span for every RAG stage and build a waterfall view of your slowest 1% of requests.
- Write down a p95 TTFT target and subtract the LLM's own p95 for your typical prompt size to get the retrieval budget.
- Make dense and keyword retrieval run concurrently and put deadlines with fallbacks on rewrite and rerank.
- Measure recall at several rerank depths and align the chosen depth with the reranker's batch size.
- Hedge idempotent calls such as embedding and search after their p90 latency, and track how often hedges fire.
- Alert on prompt-token p95 and per-stage p95, not on mean end-to-end latency.
Sources and further reading
- The Tail at Scale (Dean and Barroso, Communications of the ACM, 2013)
- Efficient and Robust Approximate Nearest Neighbor Search Using Hierarchical Navigable Small World Graphs (Malkov and Yashunin)
- Retrieval-Augmented Generation for Knowledge-Intensive NLP Tasks (Lewis et al., NeurIPS 2020)
- OpenTelemetry semantic conventions for generative AI
- Elasticsearch reference: reciprocal rank fusion
Related in this series:
- Cross-Encoder Reranking Depth: How Many Candidates Are Worth the Latency
- HNSW Tuning for RAG: M, efSearch and the Recall Versus Latency Trade
- Multi-Hop Questions in RAG: Iterative Retrieval and Query Decomposition
Diagrams, examples and the lab model are original educational material. Lab numbers are calculated by a synthetic model, not measured on real hardware or services.
Views are my own and do not represent any employer, past or present.